A large portion of the world we now live in, happens online. We wake up in the morning not to an alarm clock, but to our wearable devices connected to smart phones. We research things, watch videos, catch up with friends on social networks. We even get directions and book our vacations online. And everything we do leaves a trail of data behind it.
As a consumer, you might not know this, however, as a marketer, you’re using all this consumer data to make better decisions and thinking about how to spend your marketing dollars and improve your websites and mobile apps to optimize the customer experience. All the above is Digital analytics.
By definition data analytics is the process of analysing digital data from various sources like websites, mobile applications, among others. Digital analytics is a tool used by organizations for collecting, measuring, and analysing the qualitative and quantitative data. This data consists information on what your visitors/users are doing, where they come from, what content they like, and a lot more.
Type of data that can be analysed:
Structured data
- Sales Record
- Payment or expense details
- Payroll Details
- Inventory details
- Financial details
Unstructured Data:
- Email and instant message
- Payment text description
- Social media activity
- Corporate document repository
- News feed.
Business value of digital analytics:
- Identifying unknown risks.
- Deeper insight into business to predict customer trends.
- Act with confidence, based on numbers.
- Targeted approach based on your actual user base.
- Deep Analytics and comparisons into different behaviour of your user base.
- Interactive visualizations of trends
- Ability to curate projects and then share with non-analysts, making analytics more approachable than ever.
Digital Analytics Use Cases:
Modern analytics framework empowers the ordinary businessmen by bringing advanced analytics tools to their desktop. In Retail it helps to predict sales outcomes for the immediate future and in Healthcare it predicts risk of potential threats to patients’ wellbeing. Financial and risk management uses Big Data, along with predictive analytics, in forecasting demand. The Consumers and Practitioners of Digital analytics can range from a CXO to a Product Owner.
Stages Involved in Digital Analytics:
- Curate: Transforming data in a standard structure to be usable.
- Profile: Validating data at a macro level.
- Analyse: Examining data to discover essential feature.
- Investigate: Observing the data in detail.
- Reporting: Documenting and reporting in granular form as per the requirements.
Every organization, regardless of size, requires analytics tools to understand the performance of its website/app, satisfaction of its consumer and gain key context from business rivals. Most Common subset of digital analytics is to analyse the website data that is called web analytics and further let’s know how it is implemented.
Web Analytics Tools:
These tools help us to go way beyond counting hits and page views. It help us to make decisions and find the answers to questions. Different people and different roles in your organization will need different sets of data and different levels of granularity.
For example, a company head will be interested in seeing what the trends of yearly revenues are? A marketing manager might want to drill deeper and understand which marketing channels are driving those revenues? Using the data generated by an e-commerce site, these tools can tell us which products are selling well and which ones aren’t. This can help in inventory management, sales forecasting and even manufacturing or procurement decisions. And we can even deep dive and see which products are selling well in which geographic region.
Following are some trending web analytics tools:
- Google Analytics
- Adobe analytics
- ClickMeter
- Crazyegg
- Clicky
Key Concepts of the tools:
Events: Events are user interactions with content that can be measured independently from a web page or a screen load. Downloads, clicks, Flash elements, and video plays are all examples of actions you might want to measure as Events.
Dimension and Metrics: Every report in Analytics is made up of dimension and metrics. Metrics are the quantitative numbers that are measuring data in counts, ratios, percentages. Whereas dimensions are the qualitative categories that describe the data in segments or breakouts.
Page View: The number of page views refers as a count for every time a visitor loads that page.
Referrers: Indicates where the users came from, and are separated into four main types: Search Engines, Other Websites, Campaigns and Direct Entry.
Visitor: The user who made the visit. We may find the visitors divided in new visitors and returning visitors, which lead us to fidelity indexes. It also may contain a large amount of technical information about their computer, browser, operating system, screen size, plugins, location, etc.
Segmentation: Segmentation isolate your data into subset for deeper analytics and solves your problems, you can always segment your data by following: – Date and time – Device – Marketing channels – Geographic channels – etc. (Dozens of options)
Significance of Web Analytics Testing
The web analytics testing services are important to help you to see how your users are connecting to your sites. For the increment of conversions rate, you should use different testing method including Web analytics A/B testing and WAAT using selenium.
Web analytics A/B testing: This testing help us to compare two or more versions of an application or a web page outcomes. Also it enlightens you regarding the execution of clickable components of your website page. With this you’re pitting two versions of your asset against one another to see which comes out on top. This assists in getting a site with continuous execution development. Web analytics automation testing framework:
WAAT (web analytics Automation framework) is an open source and valuable framework that provides a way to automate the verification of name value pair properties / tags being reported to a Web Analytics System
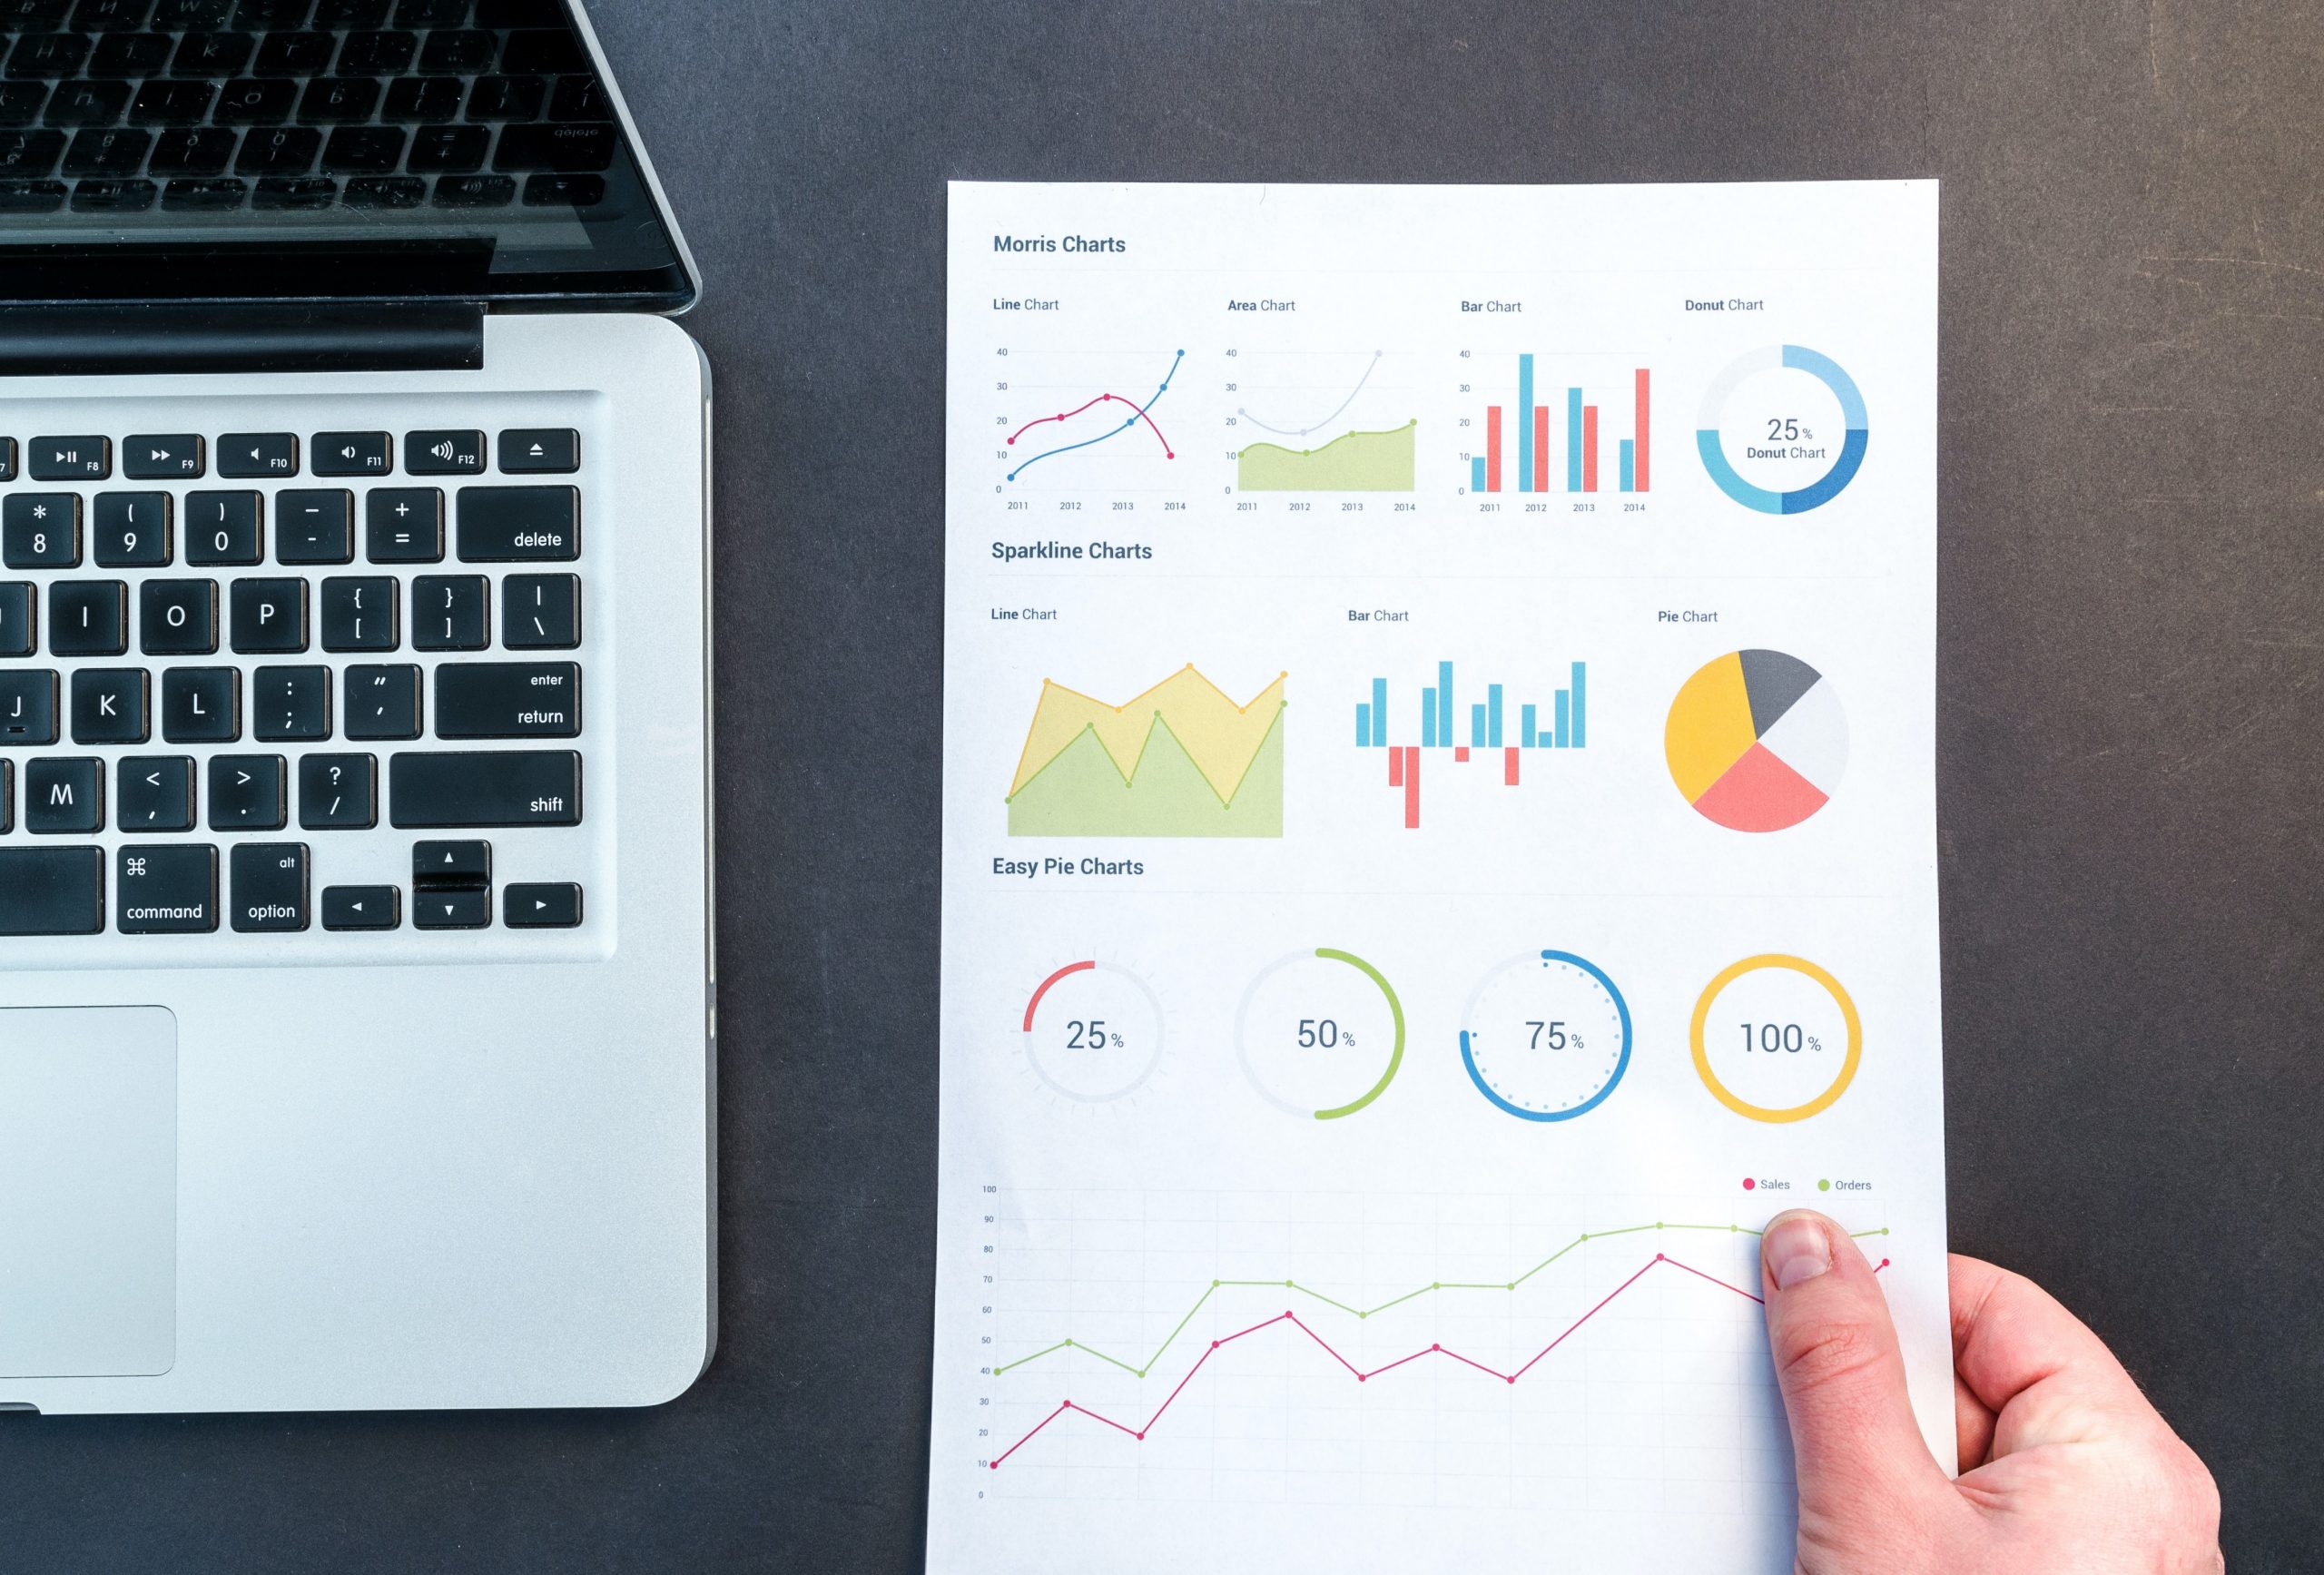
Typical Business Dashboards for a web application:
- Top visited pages or journeys that is most valuable from a customer traffic,
- Revenue (by marketing channel or program)
- Opportunities and prospects
- Conversion rates, Geographic data
Culmination: In simple words it is a way of collecting and analysing what’s happening on your application i.e. what your visitors/users are doing, which is great for businesses that you want to develop and evolve without taking huge risks.